|
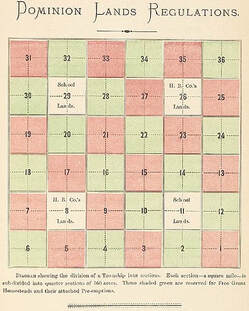
Walking in the footsteps of your ancestors is something few people can rarely say they’ve done, but it’s one of the most poignant experiences you can have. With technology, it’s easier than ever to stand where those who came before us have stood. Google My Maps is a valuable tool to visualize your research findings while making your family history come to life. With Google My Maps, you can plan the best close-to-home Manitoban summer trip that you won’t soon forget! If your ancestors were city dwellers, you may not need much investigation to find where your family called home, but for those with ancestors who lived in rural Manitoba, it’s a bit trickier. These steps will take you through how to use land descriptions from historical records to locate that land on modern maps. Rural land division in Manitoba is organized in two ways, the township grid system, or the parish/river lot system. When looking for the piece of land your family called home, searching for the legal land description is key. The legal land description can be found in the records like censuses, land records, or estate records, to name a few.
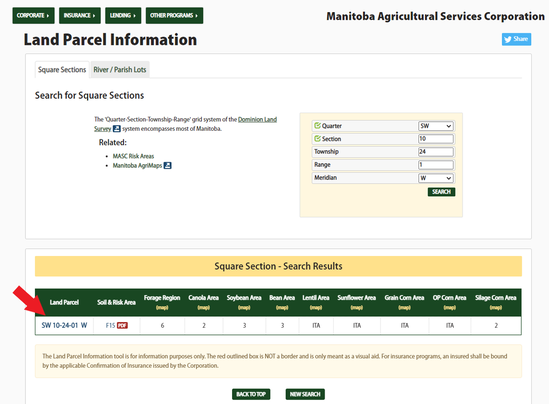
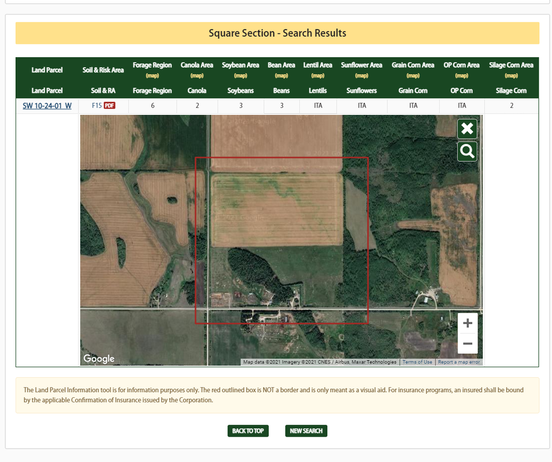
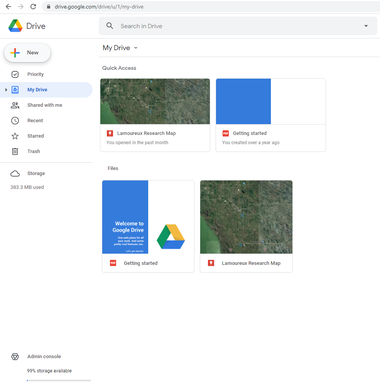
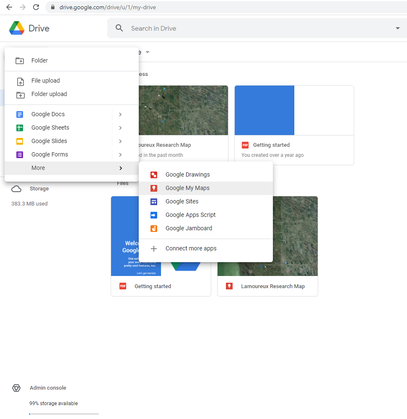
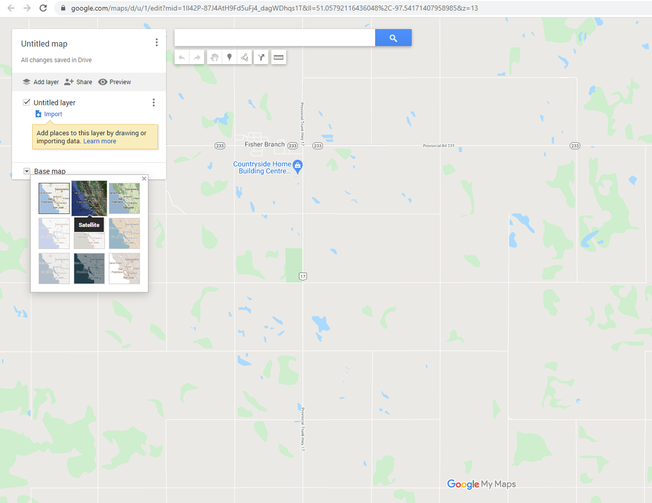
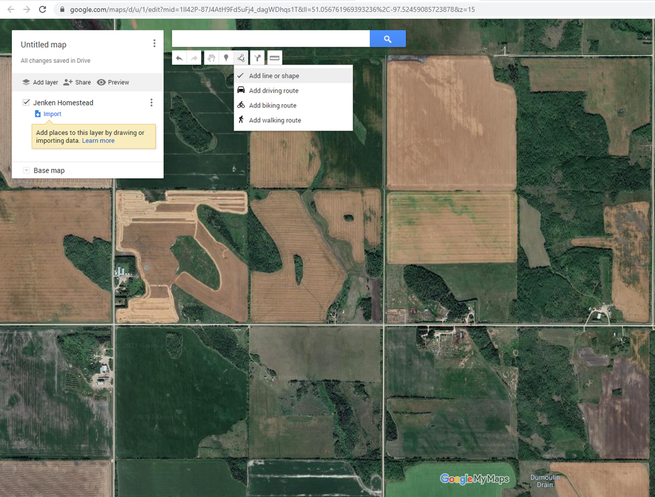
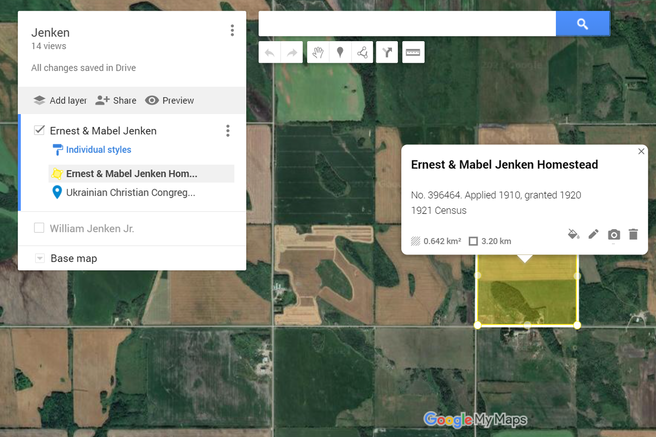
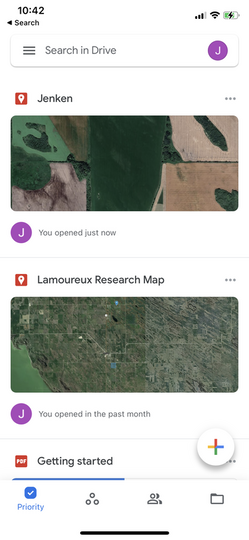
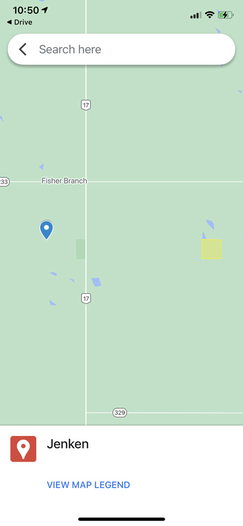
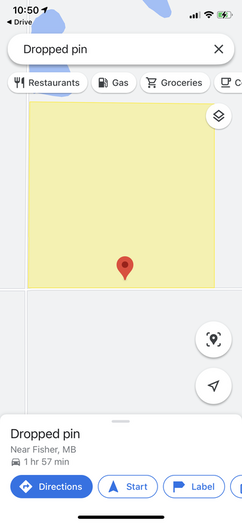
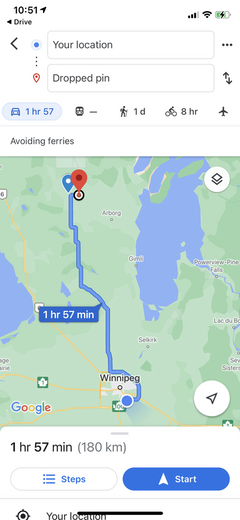
Parish lots or river lots are based on the French seigneurial system. These lots are long and narrow and offered equal access to valuable resources like roads or water. In Manitoba, this system is mainly found around the Red and Assiniboine rivers. More information about land division and available land records can be found at FamilySearch or LAC. Now that you have found the legal description of the land in records, you can locate it on modern maps. I have found that one of the easiest ways to pinpoint the tract of land on a map is by using Manitoba Agricultural Services Cooperation (MASC). Their website allows you to search legal land descriptions, returning results outlining the piece of land on their map. I primarily use this for finding square sections but some river/parish lots can be found here as well. 1. Use the drop-down menu on the MASC website to search your land parcel. Click on the land description. Now using Google My Maps, we can save this information and revisit it anytime using these next steps. 2. Open a new widow or tab and sign into your Google account. 3. Go to your Google Drive and click “New”. 4. Hover over “More” and select “Google My Maps”. 5. Orient yourself using the MASC website’s map and find the approximate area on Google My Maps by using roads and landmarks. 6. Once you’re in the right area, change the map to “satellite” view. This will help you to see the quarter sections more clearly. 7. When you have found the quarter section, you can mark it using the “add a line or shape” feature. This tool will allow you to draw a square marking the quarter section where your ancestor lived. 8. Click on the pencil icon to name the feature. I like to add the names of the ancestors who lived there for easy recognition. You can also add details in the description like a homestead grant number, the year they were living on the property, or any other relevant information to your project. 9. Colour code your map for easy identification using the paint can icon. This is a great way to differentiate family groups or different family branches if they all lived in the same area. 10. Add other important places like churches, schools, etc., by clicking “add marker” to include even more detail to your ancestor’s life story. The way you organize your map is customizable based on your goal. Now that your Google My Maps has been created, you’re ready for a road trip. Using your phone or other device, access your map on the Google Maps app. Drop pins by pressing and holding your finger to your first stop and click directions. Whether you use this tool in your research, to share your family history, or as a fun interactive way to explore your roots, incorporating Google My Maps is an easy and fun way to elevate your family history.
0 Comments
Have you ever heard of genograms? They’re not widely used in genealogy, but they should be! Genograms are traditionally used as an assessment tool in some types of family therapy. I’d argue that doing genealogy research is family therapy; we search for truth, process what it means and ultimately ask what that information tells us about our families and ourselves. Motivations for genealogy research are varied. One psychiatrist has grouped searchers into two categories: those who view searching as an “adventure” and those who view searching as “therapy”.[1] Whether you fall into either of those groups, or somewhere in-between, genograms can give you a unique perspective into your family tree. What makes genograms different than other genealogy charts? Well, a genogram is less static than a regular family tree view. They can include all the key vital information (birth, marriage, and death particulars), but also have the added benefit of displaying even more information that can be used to understand the family environment. Important events such as marriages, deaths, separations (divorce), immigration, etc. should be carefully studied, recognizing that these events can send shock waves through a family that could potentially affect future generations. With other genealogy recording methods, there’s no fast, visual way of showing these events and their impact in a holistic way without digging into family notes or written family narratives. As genealogists, we can utilize this tool to discover new and interesting things about our families that we might not have seen until we sketch it out, which can ultimately give us other avenues to research. Genograms can be visualized with one family unit or up to 5 generations and can be a generalized view or focused on a specific year or life-stage. With a glance at a genogram you can spot patterns, quickly recognize events, and relationship dynamics which can save you time and add more insight into your research. 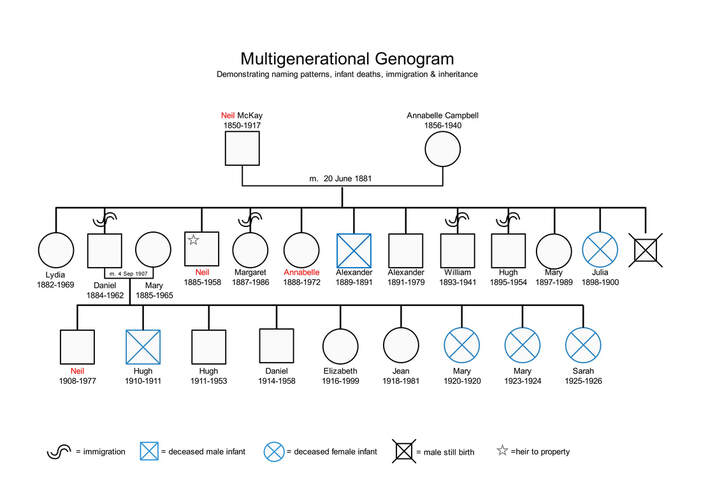 We can see three generations on this genogram with names, birth, marriage, and death dates. Additionally, I have added immigration detail, infant deaths, and stillborn babies, three things you would not normally see in a visual chart. I have highlighted in red, a Scottish naming pattern and can now hypothesize about Neil and Annabelle’s parents’ names. This hypothesis is strengthened by the inclusion of the names of the infants that had died young. The star, which I chose as the symbol to indicate the heir to the family land, shows Neil inherited it, not Daniel, who is the eldest son. It is easily seen here that the possible reason for this is that Daniel immigrated to a different country therefore the land was given to Neil instead. 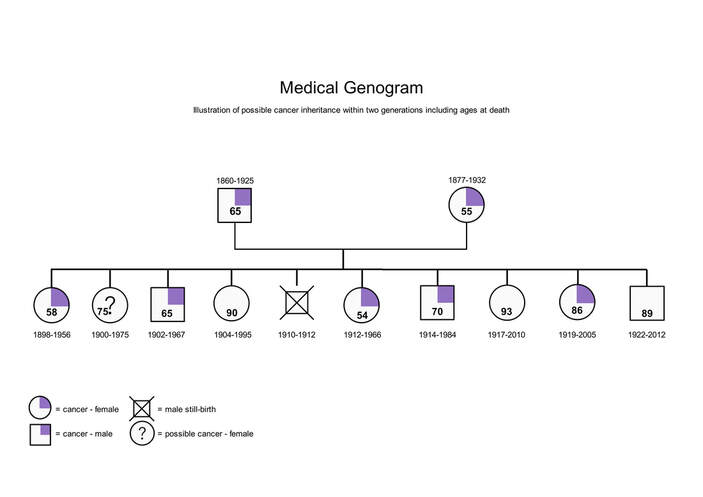 This genogram shows cancer in one nuclear family. I could have extended it to also include more generations. In this example, I’ve included the ages at death along with birth & death dates. This serves two purposes; medically, to portray how potentially aggressive these cancers were, and secondly, to put into perspective the loss felt with the death of the parents at a young age. Alternatively, I could have focused on that aspect more by also including the children’s ages at the time of their parent’s death. If more generations were added, the loss of parents at young ages could be a theme explored in this family’s history and the potential impact it could have had. Benefits of genograms are that they allow you to better visualize: More complicated family relationships (i.e. adoption with another family involved, foster children, bigamy, blended families, etc.) Medical genealogy. Quickly and easily see patterns of hereditary, and environmental related diseases or illnesses. Although you might know that cancer, diabetes, alcoholism, or addiction runs in your family, seeing the pattern may help you see things you hadn’t noticed before. Household makeup. By drawing lines around which family members are living together and seeing which ones are not, provides a better understanding of how they interacted (if at all). Immigration patterns. Dates and places of immigration can also be added, revealing patterns of possible push and pull factors for immigration, such as chain migration, socio-political forces, etc. A snapshot in time. Much like timelines, this allows us to imagine what could have been happening for that person or around them, to overcome research problems. Family secrets (i.e. society memberships, bigamy, criminal acts, etc.) Military involvement. Education or occupation patterns that aren’t normally recorded in visual chart form. Religious affiliation. Was there a change? What could have precipitated that change? Physical or character traits. Trace hair colour, eye colour, musical talents, etc. Racial Identity. You can trace what they themselves identified as, perhaps exposing a pattern, suggesting there may have been a reason for that switch, for example, laws being passed, social attitude shifts, starting over in a different area, etc. Miscarriages/ stillbirths. Although this is not usually known the further back we reach, more recent family trees may benefit from the addition of these details which are not usually easily recognizable in other charts, if included at all. Naming patterns. This can help for formulating a hypothesis or used as additional evidence for identifying possible names of people based on traditional naming patterns. Heir succession. This can sometimes be more complicated. Tracking heir succession can offer even more insight if inheritance does not follow a normal pattern. The list goes on and on… 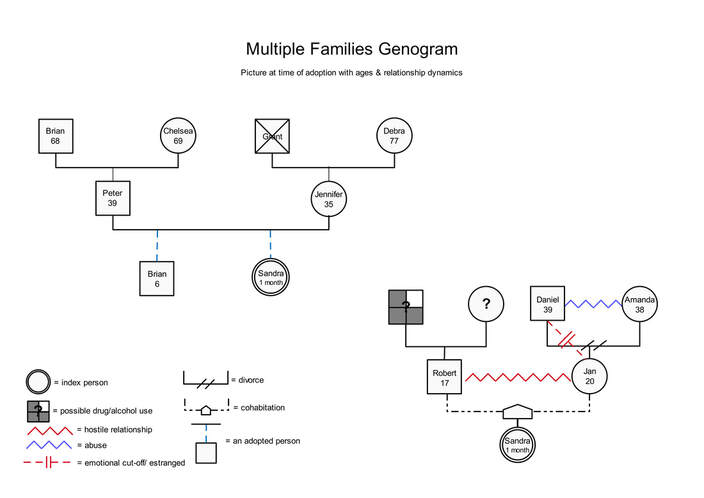 Here we see “Sandra”, an adoptee seen in both her birth family (right) and her adoptive family (left) at the time of the adoption. The relationship dynamics depicted in this genogram have been included from information about the birth family found in her background information at the time of adoption and through research done years later. For some, genealogy research, or more precisely, the feelings brought up by it, may be of no interest or a difficult topic to approach. They could struggle with difficult emotions surrounding their families, have disconnected relationships or traumatic events as part of their story. It would make sense that they wouldn’t feel as if genealogy is for them since the atmosphere often projected by family history research is one of honour, pride, and sharing in our families’ achievements. Traditional genealogy charts, such as the pedigree chart, identifies facts but sometimes lacks the depth needed to make sense of those facts and events within a multigenerational family system. The benefit of including the genogram along with traditional genealogy research and chart preparation is that it has the potential to make sense of events, environment changes, past traumas and their effects on the family, and generations that follow. Relationship dynamics, psychological and emotional atmosphere that one grew up with can be represented, to hopefully illuminate choices, or events that led to those mixed feelings we have about people who came before us. In this way, it doesn’t have to be about pride in heritage but a means to process the past. It can be a tool, if you let it, to heal family wounds. There are so many ways to use genograms in genealogy research. They are one more tool you can add to your research tool belt, and the best part is, it’s entirely up to you how to use them! There are standard symbols used but if you can’t find one that fits, you can create your own. Depending on the question, goal or situation you’re trying to assess, genograms offer a different perspective on your family tree. [1] Robert S. Anderson, “The Nature of Adoptee Search: Adventure, Cure, or Growth?” Child Welfare 68, no. 6, (November/December 1989): 623-32.
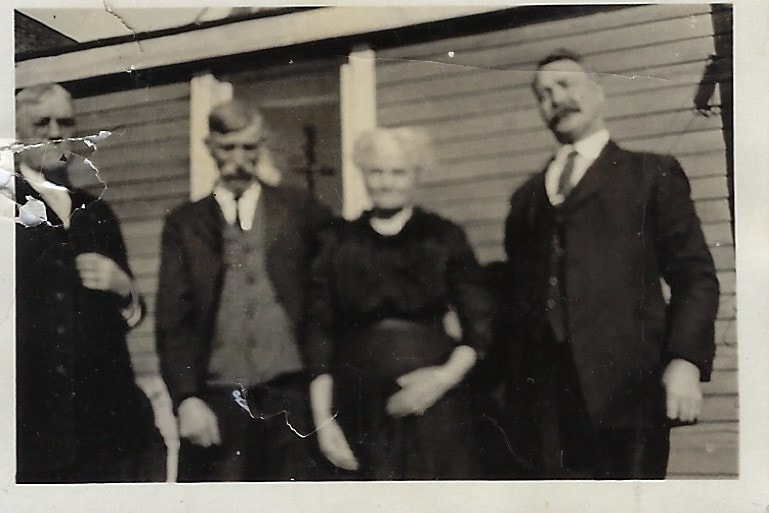
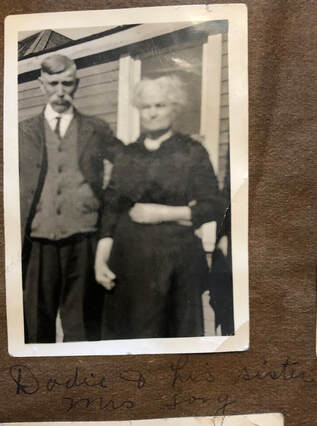
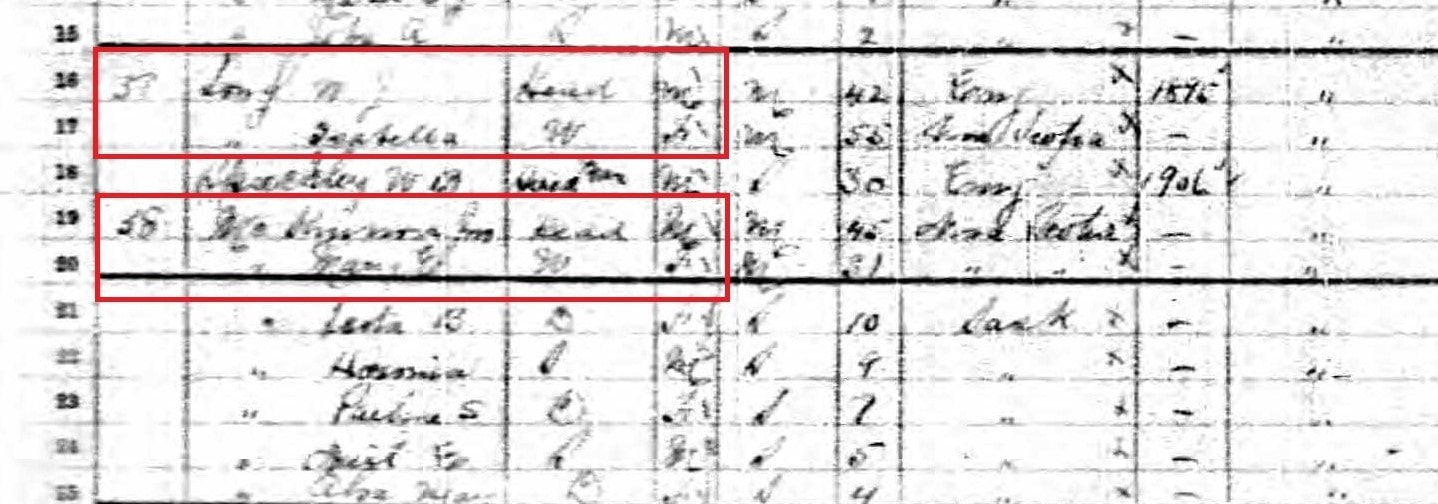
I have been working on my brick wall ancestor, Daniel George McKinnon (abt. 1858-1925) for many years now with not much success. The question of who his parents were has been like an unrelenting itch that I just can't reach, and my goal for 2019 is to finally solve this mystery. Since January, I have been retracing my research, searching for things I’ve missed, doing DNA analysis and tracing cousin’s trees all in the hopes of providing a new lead. Daniel and John A. McKinnon, brothers, show up in Whitewood, Saskatchewan in the early 1890s. They were born in Cape Breton, Nova Scotia, but all census records from Saskatchewan have variations on their dates of births and even their place of birth, one record suggesting it was not Cape Breton but Prince Edward Island. Civil registration in Nova Scotia did not start until after they were born, and finding marriage records has been difficult in Saskatchewan. Everything up to this point has made it seem like they just showed up, out of thin air, with no past. Obviously, this isn’t the case and I was going to find out where, or rather who they came from. Through my online family tree, a close (but unknown to me) cousin reached out to me. She was kind enough to send me this photo with John McKinnon (right). I hypothesized that the man second from the left was my great-grandfather, Daniel, but only seeing one other photo of him, I was not sure and I certainly didn’t know who the woman in the middle was. Long, John William (presumably), Daniel McKinnon, Isabella Long (nee McKinnon), John McKinnon. Photograph. n.d.. Digital image. Photo courtesy of Anna McKinnon. 2019. With Saskatchewan being one of the most difficult provinces to research from afar, I decided to take a 4 hour ride to the small town in hopes to make progress. While preparing for this trip, I had the opportunity to look through a family photo album again after 10 years. After extensive research on the families and with help from other distant cousins, people in photos that were once unknown to my family, I now recognized. One photo in particular caught me eye, it was the same (but different) photo that my cousin had shared with me! It was obviously taken at the same time and I could tell there was another person standing to the right, out of frame. Thankfully, this photo had the inscription “Dadie [sic] with his sister Mrs. Long”. "Dadie [sic]", I knew from the owner of this album, meant it was in fact Daniel McKinnon. He had a sister AND we have a married surname! Fellow genealogists realize how instrumental this discovery was. McKinnon, Daniel and Isabella Long (nee McKinnon). Photograph. n.d.. Digital image. Personal collection. 2019. Now having another person to track and hopefully connect to Daniel and John, I reviewed census records looking for Mrs. Long in Whitewood and surrounding area. BOOM! There she was, right above her brother John McKinnon and I never knew her significance. This along with an article giving a first name, Isabella, along with her husband, confirmed her relationship to her brother, John Alexander McKinnon, I now had yet another sibling to research to hopefully aid me in identifying their parents. Canada. Saskatchewan. Assiniboia East. 1906 Canada Census of Manitoba, Saskatchewan, and Alberta. Digital Image. Ancestry.ca. http://www.ancestry.ca : 2019. Bonus: Isabella is also the name of one sibling of my potential DNA match family, born approximately at the right time. The photo of the siblings, supporting newspapers articles and census records have added to my growing circumstantial case of these McKinnon siblings’ parentage. What did I learn?
|
AuthorI'm Jessica Landry, a professional genealogist based in Winnipeg, Manitoba. ArchivesCategories |
NAVIGATE |
INFO |
|
 RSS Feed
